Breaking: Inventory Divide Grows as Housing Market Power Tilts in States
National Inventory Up, but Growth Slows
The shift in housing market power from sellers to buyers is deepening, but at an uneven pace across the United States. National active listings rose 4.6% year-over-year as of April 2026, according to Realtor.com data, reaching 1,002,935 homes for sale. However, that growth has slowed dramatically from the +30.6% pace seen just 12 months earlier.
Despite the increase, inventory remains 11.8% below pre-pandemic April 2019 levels, signaling persistent tightness in many markets. ResiClub analyst Lance Lambert notes, “The national supply-demand equilibrium has stabilized in recent months, but the story is far from uniform—state-by-state gaps are widening.”
The Power Divide: Where Buyers (and Sellers) Rule
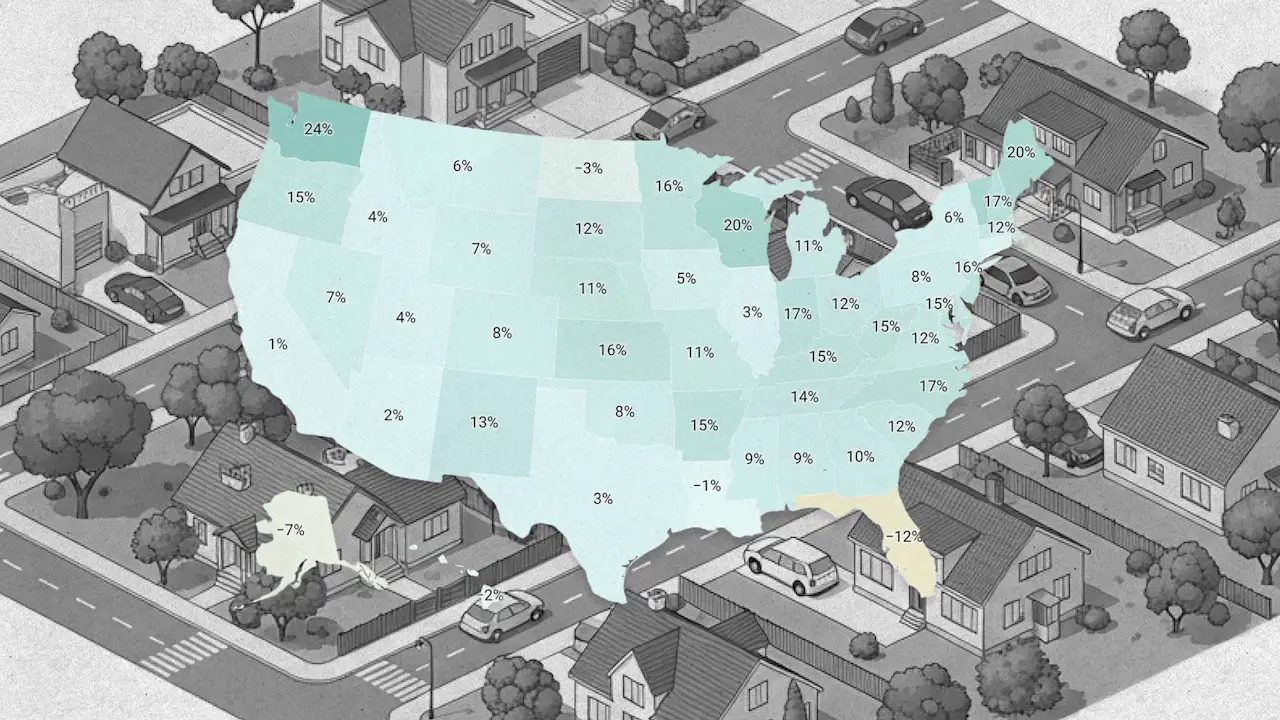
Since the pandemic-fueled boom peaked in 2022, leverage has gradually shifted from sellers to buyers. Yet this transition is strikingly regional. States where active inventory now exceeds 2019 levels have experienced softer home price growth—or outright declines—over the past 47 months. Conversely, states where listings remain well below 2019 levels have seen more resilient price appreciation.
For example, several Sun Belt states such as Florida, Texas, and Arizona have inventory above pre-pandemic benchmarks, giving buyers more negotiating power. In contrast, the Northeast and Midwest—including New York, Massachusetts, and Minnesota—continue to suffer from severe shortages, keeping sellers firmly in control.
Key States at Extreme Ends
- Highest inventory relative to 2019: Florida, Texas, Arizona, Colorado, Georgia
- Lowest inventory relative to 2019: New York, Massachusetts, Minnesota, Connecticut, Rhode Island
Lambert explains: “Local markets where inventory has surged above 2019 levels are seeing the greatest price softness. That’s where buyers finally have the upper hand.”
Background: Inventory as a Key Market Signal
Active listings and months of supply are critical indicators of housing market health. When listings rise rapidly and homes stay on the market longer, pricing tends to weaken. A sharp drop in listings, beyond seasonal trends, often signals growing seller power.
During the pandemic boom of 2020-2021, listings plunged to historic lows—April 2021 had just 435,663 active homes, compared to over 1.1 million in April 2019. As the boom faded in 2022, inventory began to recover, but the recovery has been sluggish and uneven.
What This Means for Buyers and Sellers
For homebuyers, the national landscape is improving, but location matters more than ever. Buyers in high-inventory states can expect more choices, slower price growth, and the ability to negotiate. In low-inventory states, fierce competition and bidding wars persist, limiting options.
For sellers, the golden era of 2021-2022 is over in many places. Pricing realistically is now essential, especially in oversupplied markets. However, sellers in tight inventory states still hold significant leverage.
Looking ahead, if the current year-over-year inventory growth pace (adding roughly 43,684 homes annually) continues, active listings could reach 1,046,619 by April 2027. “That’s not a forecast,” Lambert cautions, “but it illustrates how the market could normalize if trends hold.” For now, the power divide between states is the defining story of the U.S. housing market.
Related Articles
- Why Zed Finally Clicked for Me When I Stopped Treating It as a VS Code Killer
- Python 3.15.0 Alpha 5 Released: Key Features and Improvements
- AI Clones Cross Ethical Boundaries: From Political Campaigns to Corporate Scams
- Trump Administration Abruptly Removes All Members of the National Science Board
- Massive Landslide in Alaska Unleashes Tsunami Wave Reaching 1,580 Feet Up Fjord Walls
- The Block Protocol: 7 Things You Need to Know About the Future of Web Content
- Garlic: Nature's Mosquito Birth Control? Yale Study Reveals Surprising Pest Control Potential
- 10 Critical Security Risks in AI Agent Systems: Tools & Memory Exposed